



Key Highlights
- Container rates diverged: Asia–Europe prices softened while transpacific rates remained firmer.
- Coal freight strengthened: Average rates across the top three geographic corridors rose 12.3% month-on-month.
- Capacity controls mattered: Blank sailings reduced departure options ahead of China’s Golden Week.
- Route changes affected costs: Selective Suez returns changed voyage duration and vessel availability.
- Inland bottlenecks persisted: Low Rhine River water levels increased European transport complexity.
In this article
Why September’s Freight Market Told Different Stories
Why September’s Freight Market Told Different Stories
The global freight market experienced contrasting conditions across container shipping, dry bulk, and inland logistics during September. While some ocean freight routes offered modest cost relief, others remained resilient, and operational disruptions continued to influence total shipping expenses. Freight pricing intelligence helps logistics managers, procurement teams, and charterers look beyond headline rate movements to understand how carrier capacity decisions, fuel surcharges, vessel availability, weather recovery, and inland transportation constraints affect overall shipping costs.
The World Container Index (WCI) settled at USD 4,468 per 40-foot container on September 24, declining 1% week-on-week. However, this overall movement concealed significant differences between individual trade lanes and vessel categories.
For logistics managers, procurement teams, and charterers, the central challenge was understanding why rates moved differently—and whether lower headline prices translated into actual savings. Carrier capacity decisions, fuel surcharges, vessel availability, weather recovery, and inland transportation constraints all influenced the final cost of moving cargo.
1. Container Shipping: Asia–Europe Softens as Transpacific Rates Hold Firm
September’s container market demonstrated the importance of evaluating freight prices by route rather than relying solely on global indices.
On transpacific routes, Shanghai–Los Angeles spot rates increased 2% week-on-week, supported by sustained cargo volumes ahead of seasonal retail stocking. Shanghai–New York rates remained unchanged, suggesting relatively consistent capacity utilization on the US East Coast corridor.
Asia–Europe routes moved in the opposite direction. Shanghai–Rotterdam rates declined 4% week-on-week, while Shanghai–Genoa rates fell 5%. These reductions provided some relief for European importers, although other logistics expenses could offset the savings.
Fuel surcharges also remained an important consideration, particularly on selected Pacific routes. Consequently, buyers comparing 20-foot and 40-foot container bookings needed to assess equipment availability, negotiated base rates, and additional charges together.
The takeaway is clear: a lower spot rate does not automatically guarantee a lower delivered cost.
2. Dry Bulk: Coal Strength and Regional Differences
Dry-bulk freight followed a different pattern from container shipping. Coal freight recorded the strongest growth, with average month-on-month price growth of 12.3% across its top three geographic corridors. Shifting energy demand and loading schedules at Indonesian and Australian origins contributed to higher rates and greater volatility.
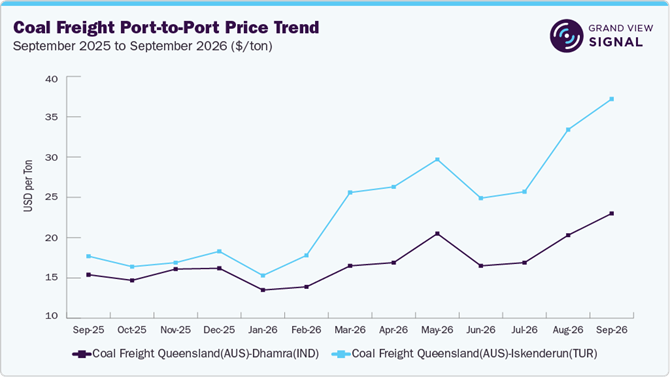
Get Full Access to Price Trends & Market Drivers.
Vessel availability also divided the market. Reduced tonnage in the Atlantic basin and steady cargo inquiries supported rates for Capesize and Panamax vessels. In contrast, Pacific activity weakened toward late September as iron-ore fixtures slowed.
The Supramax market was broadly flat late in the month, but regional demand created exceptions. Increased European ferrous scrap export activity supported employment for smaller vessels serving Mediterranean routes.
For charterers, this divergence reinforces the importance of matching cargo timing with vessel availability in the relevant basin. Waiting until the last moment in a tight market can increase exposure to higher charter costs.
3. Operational Drivers: Capacity, Routes and Inland Bottlenecks
Four operational factors shaped September freight conditions.
First, carriers adjusted capacity ahead of China’s Golden Week by announcing more blank sailings across transpacific and Asia–Europe routes. Fewer departures can concentrate cargo onto remaining services, leaving shippers with less schedule flexibility even when spot quotes ease.
Second, selected Asia–Europe services began returning to the Suez Canal route rather than continuing around the Cape of Good Hope. Shorter voyages can reduce sailing days and fuel consumption while freeing vessel capacity for subsequent rotations. However, service changes should be assessed route by route rather than assumed to affect every shipment equally.
Third, East Asian ports continued recovering from severe weather disruptions. Delays contributed to congestion, missed feeder connections, and slower empty-container returns, particularly for specialized 20-foot and 40-foot equipment on secondary corridors.
Finally, low water levels on the River Rhine restricted barge loading capacity in Central Europe. Operators had to sail with reduced loads or divert freight to rail and road, increasing door-to-door costs for cargo moving through gateways such as Rotterdam and Antwerp.
What Freight Buyers Should Do Next
Freight procurement teams should evaluate schedule reliability alongside quoted prices, especially for time-sensitive cargo affected by blank sailings. They should also calculate total landed costs, including fuel surcharges, inland diversions, and drayage, rather than comparing ocean rates in isolation.
Dry-bulk charterers should align laycan windows with local vessel availability and monitor commodity-specific activity, particularly in volatile coal and iron-ore corridors. Across all modes, timely freight pricing intelligence can help teams identify regional shifts and respond before bottlenecks disrupt inventory plans.
Frequently Asked Questions
1. What was the World Container Index on September 24?
It settled at USD 4,468 per 40-foot container, down 1% week-on-week.
2. Which container routes declined during September?
Shanghai–Rotterdam fell 4% week-on-week and Shanghai–Genoa declined 5%.
3. Which freight segment recorded the strongest monthly growth?
Coal freight, averaging 12.3% growth across its top three geographic corridors.
4. How do blank sailings affect shippers?
They reduce departure options and can constrain schedule flexibility, even when headline rates decline.
5. Why do Rhine River conditions affect total freight costs?
Low water levels restrict barge loading, potentially requiring reduced loads or more expensive rail and road alternatives.