



Key Highlights
- Fertilizer prices respond differently to energy, feedstock, and trade conditions.
- Nitrogen, phosphate, and potash have distinct pricing drivers.
- Regional supply and import conditions can create divergent price movements.
- Freight, export restrictions, and inventories influence procurement costs.
- Historical pricing and predictive analytics support more informed sourcing decisions.
In this article
Understanding the Forces Behind Fertilizer Price Cycles
Three Fertilizer Categories, Three Different Pricing Dynamics
Regional Differences Reveal Where Pricing Pressure Is Building
Turning Price Intelligence into Better Sourcing Decisions
Understanding the Forces Behind Fertilizer Price Cycles
Fertilizer procurement has become increasingly complex as agricultural supply chains face changing energy costs, geopolitical uncertainty, export restrictions, and freight disruptions. These factors influence the availability and cost of essential crop nutrients, making purchasing decisions more difficult for manufacturers, distributors, traders, and large agribusinesses.
A uniform view of the global fertilizer market can be misleading. Prices vary by product, production location, inventory position, and import dependency. Buyers therefore need more than occasional price updates. They need structured market intelligence that connects current assessments with historical movements and emerging supply risks.
Fertilizers pricing intelligence helps procurement teams interpret these developments, evaluate regional differences, and make decisions based on measurable market signals rather than fragmented information.
Three Fertilizer Categories, Three Different Pricing Dynamics
1. Nitrogen: Energy Costs Set the Tone
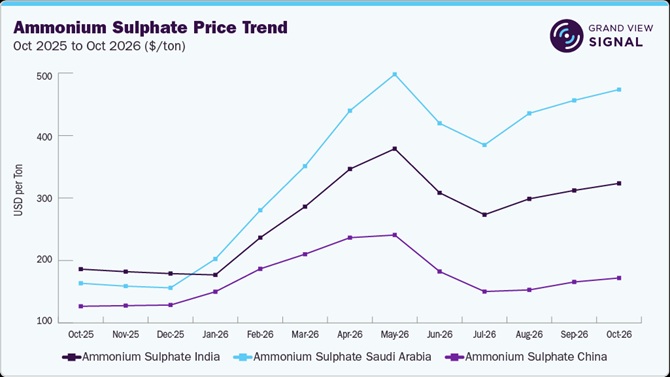
Nitrogen fertilizers, including urea, ammonium sulfate, and ammonium nitrate, are closely connected to natural gas and coal markets. Changes in energy prices can affect production economics, while plant maintenance, supply recoveries, and export restrictions influence product availability.
Get Full Access to Price Trends & Market Drivers.
China’s production and export activity can have wider consequences for international benchmarks. European purchasing schedules and plant operating conditions also contribute to regional supply fluctuations. In the assessed period, urea recorded an average month-on-month growth of 2.4% across major geographies, while maintaining a stable volatility profile.
2. Phosphate: Feedstocks and Freight Matter
Phosphate fertilizer pricing depends on phosphate rock, sulfur, ammonia, and downstream demand for products such as monoammonium phosphate (MAP). Production costs are only part of the equation. Freight rates and import timing can create differences between domestic and destination-market quotations.
For example, MAP prices may soften in a production hub such as Hubei when feedstock costs decline or inventories are drawn down. At the same time, prices in the United States may remain comparatively firm because of local logistics and import conditions.
3. Potash: Supply Concentration and Inventories
Muriate of potash (MOP), potassium nitrate, and sulfate of potash (SOP) are influenced by mining concentration, port inventories, international shipping costs, and long-term supply negotiations.
Inventory accumulation at major discharge ports can weigh on prices, while changes in availability from important Eastern European producers can alter trade expectations. Monitoring these factors helps buyers understand whether price movements reflect temporary inventory pressure or a broader supply shift.
Regional Differences Reveal Where Pricing Pressure Is Building
Fertilizer markets do not move in unison. Regional assessments help identify where supply is tightening, demand is weakening, or import economics are changing.
Asia Pacific: China and India
China’s fertilizer prices declined by an average of 1.8%, with five of seven assessed products moving lower. MAP recorded a 9.3% decline amid domestic supply accumulation and phosphate export restrictions. Urea fell 1.4%, while MOP decreased 2.3% as port inventories built up. Ammonium sulfate was an exception, increasing 3.9% on its monthly average.
In India, urea import quotations declined 4.8% following the October 7 import tender. Approximately 410 kt was secured against demand for 1.7 Mt, indicating the possibility of another substantial tender. DAP also reached its lowest assessed level since April, while MOP contract pricing remained stable.
Europe and North America
European fertilizer prices were broadly unchanged, but individual products moved in different directions. Urea increased 1.2% and MOP gained 1.5%, while potassium nitrate and SOP declined. Elevated European gas prices and below-normal German storage levels supported nitrogen production costs and import demand.
In the United States, fertilizer prices increased by an average of 0.5%. Retail anhydrous ammonia rose 5% month-on-month, while retail urea remained 13% higher year-on-year. However, import urea declined 3.0% amid subdued purchasing and import volumes at an eight-year low.
Middle East and North Africa
Maritime disruption, freight expenses, and war-risk insurance continued to influence fertilizer import costs in Saudi Arabia and the UAE. Imported ammonium sulfate and MOP prices increased even as granular urea weakened.
In Egypt, urea gained 1.8% as European buyers sought alternative supply. Morocco’s average fertilizer prices declined 0.5%, while lower sulfur input costs offered support to phosphate producer economics.
Turning Price Intelligence into Better Sourcing Decisions
Regional price differences create opportunities as well as risks. Manufacturers can track ammonia, sulfur, and phosphate rock costs to improve feedstock purchasing and production scheduling. Agribusinesses can use price assessments to evaluate purchase timing, manage seasonal exposure, and plan cost pass-throughs. Traders and distributors can monitor regional spreads, port inventories, and trade flows to identify sourcing opportunities and manage inventory risk.
A disciplined sourcing process should combine three elements:
- Historical context: Compare current prices with longer-term trends to distinguish temporary movements from persistent changes.
- Regional visibility: Assess prices across production and consumption markets rather than relying on a single global benchmark.
- Forward-looking analysis: Monitor supply bottlenecks, trade restrictions, energy costs, and freight risks that could affect future availability.
Strengthening Fertilizer Procurement with Grand View Signal
Grand View Signal supports market monitoring across more than 200 primary and secondary energy commodities? No—fertilizer procurement decisions require fertilizer-specific market coverage, so the relevant capabilities described here are monthly fertilizer tracking, historical pricing datasets spanning over a decade, regional Average Selling Price (ASP) metrics, and predictive risk-quantification analytics.
These capabilities help businesses connect product-level price movements with regional trade conditions and potential supply disruptions. Rather than treating market volatility as an isolated event, procurement teams can use structured assessments to evaluate exposure, compare sourcing options, and plan purchasing activity.
The original content indicates potential direct procurement cost savings of 15–25% through data-driven pricing intelligence. Actual results will depend on individual sourcing conditions, purchasing practices, and market developments.
As fertilizer markets continue to respond to changing energy economics, trade policies, and logistics conditions, informed sourcing is becoming an important part of commercial planning. Combining historical context, regional price visibility, and forward-looking risk analysis can help organizations protect margins and build more resilient agricultural supply chains.
Frequently Asked Questions
1. What factors influence global fertilizer prices?
Energy costs, raw material availability, production levels, export policies, freight rates, inventories, and regional demand all influence fertilizer prices.
2. Why do nitrogen fertilizer prices respond to natural gas markets?
Natural gas is a major feedstock for nitrogen fertilizer production. Changes in gas prices can therefore affect manufacturing costs and supply economics.
3. Why can fertilizer prices differ between regions?
Differences in production capacity, import dependency, freight expenses, port inventories, trade restrictions, and local demand can create regional price variations.
4. How does fertilizer pricing intelligence support procurement?
It helps buyers compare regional assessments, monitor historical trends, evaluate supply risks, and make more informed purchasing and contract-timing decisions.
5. What does Grand View Signal offer for fertilizer market analysis?
The platform provides monthly market tracking, historical pricing data, regional ASP metrics, and predictive analytics to support fertilizer sourcing and risk assessment.